Waging war on UK Transport CO2e – making substantial real reductions quickly and cheaply

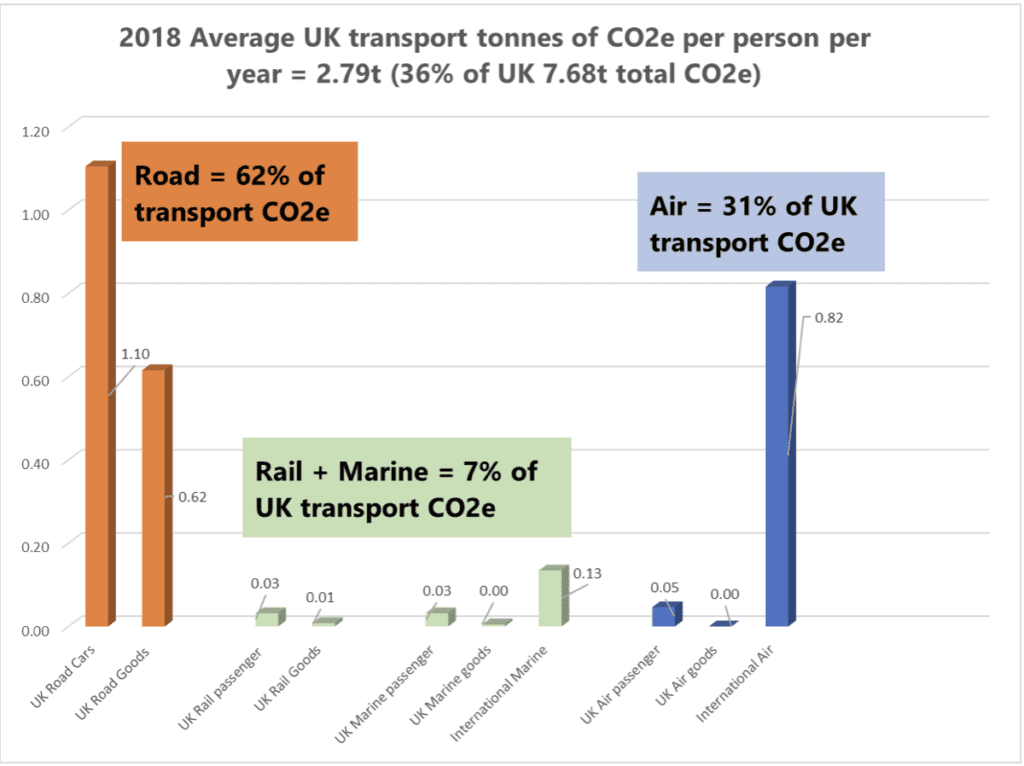
Based on 2018 UK Government data and CAA data and passenger surveys.
Logically international air travel and shipping should be included in all national carbon emission figures. For historic reasons, this key element is currently grouped separately from national statistics. UPC have worked with CAA data to identify the percentage of passengers terminating in the UK and the total number of passenger movements to calculate the 0.82t per year per head figure.
Similar logic was used with UK port shipping tonnage data, less UK transport tonnage, to calculate CO2 giving 0.13t per head per year.
What can be done quickly in transport to slash UK CO2e emissions?
UPC generated a simple automotive model to predict both fuel economy (miles per gallon) and the related CO2 gm per km. In fixed speed driving the key drag elements involved are rolling resistance from tyres and aerodynamic drag from a combination of vehicle geometric form and frontal area.
Low vehicle weight is a key element in burning less fuel during acceleration phases and going uphill. However, on long journeys going uphill is followed by coasting down hill, which balances out fuel consumption.
What do you think? Email us: technology@upccambridge.co.uk

